
Trace & Governance
Receipts for every inference, and the policy layer being built on them.
Windows only for now.
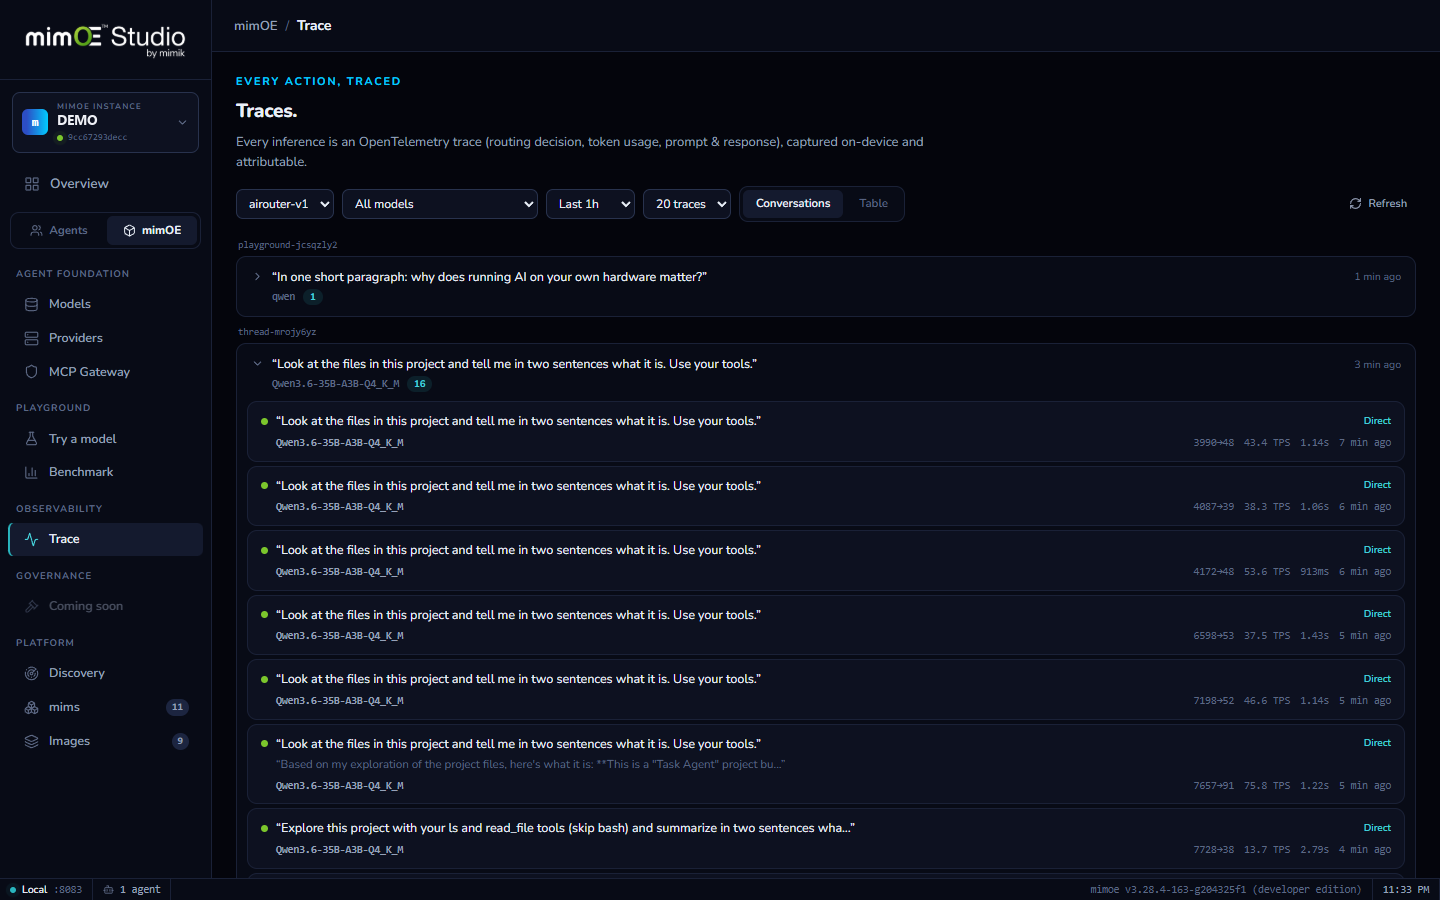
Every inference recorded
Each request through the router becomes an OpenTelemetry trace: which app asked, which model answered, how it was routed, how long it took, how many tokens it cost.
Conversation view
Raw spans are grouped into conversations, so an agent's multi-turn run reads like a transcript with metrics attached. Expand any exchange to see the full prompt and response.
Debug with evidence
When an answer looks wrong, the trace shows what the model actually received and produced. No guessing about system prompts, routing, or truncation.
Governance: coming, and honest about it
Trace is the shipped evidence layer; Governance, meaning policy, audit, and controls over what agents and models may do, is being built on exactly these records. You can already see its place reserved in the app's sidebar.
How it works
- 1
Every request leaves a span
Each call through the model router emits an OpenTelemetry trace: which app asked, which model answered, routing, timing, and token counts.
- 2
Stored on the device that served it
Traces are captured and kept on-device. Nothing is exported anywhere unless you decide to ship it to your own collector.
- 3
Read it as conversations
The Trace view groups raw spans into conversations. An agent's multi-turn run reads like a transcript with metrics attached. Expand any exchange for the full prompt and response.
- 4
Governance builds on this (coming soon)
Because every inference and tool call is already recorded at one choke point, policy and audit come next: rules about what agents may do, verified against the same records you can read today.